Vitral 0.2

Lumen Metrics

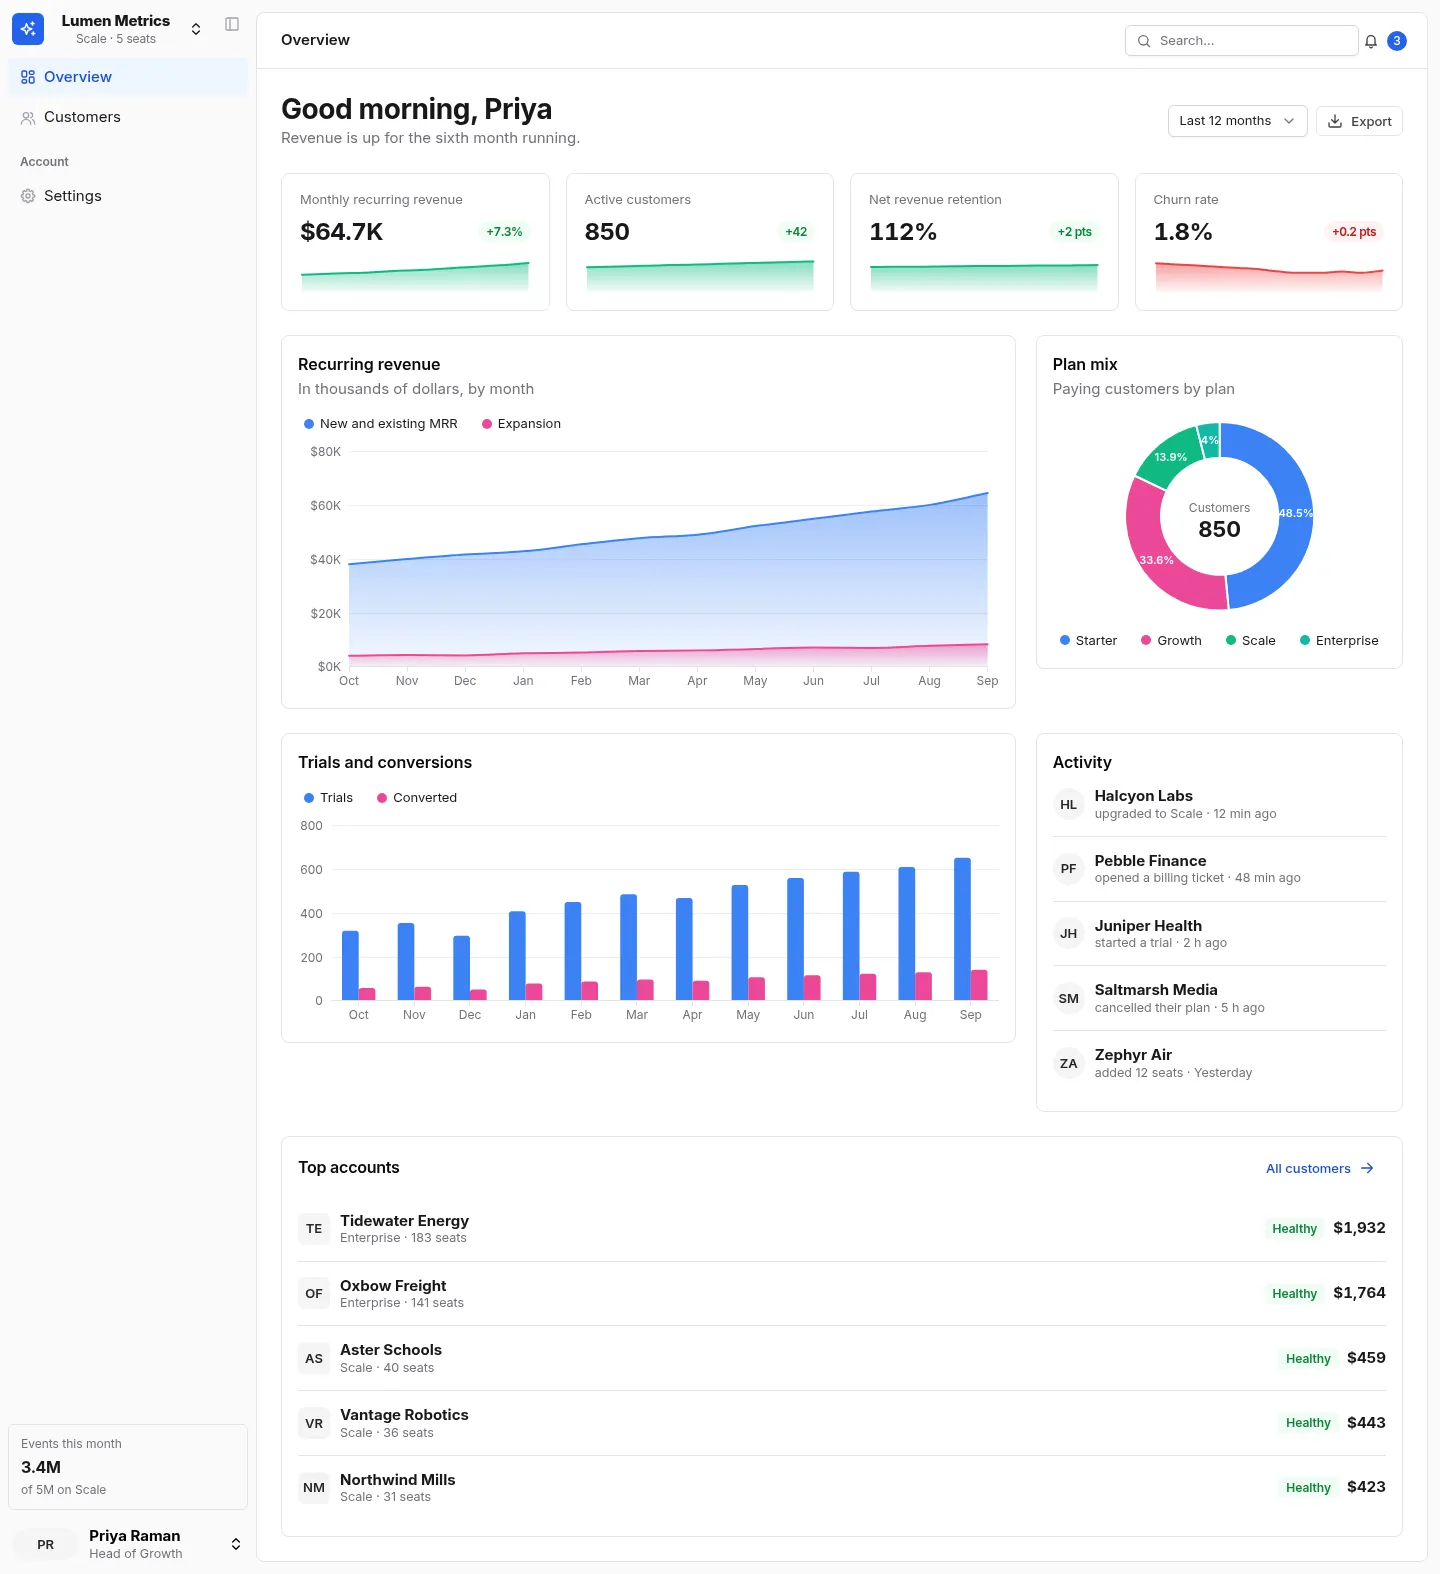
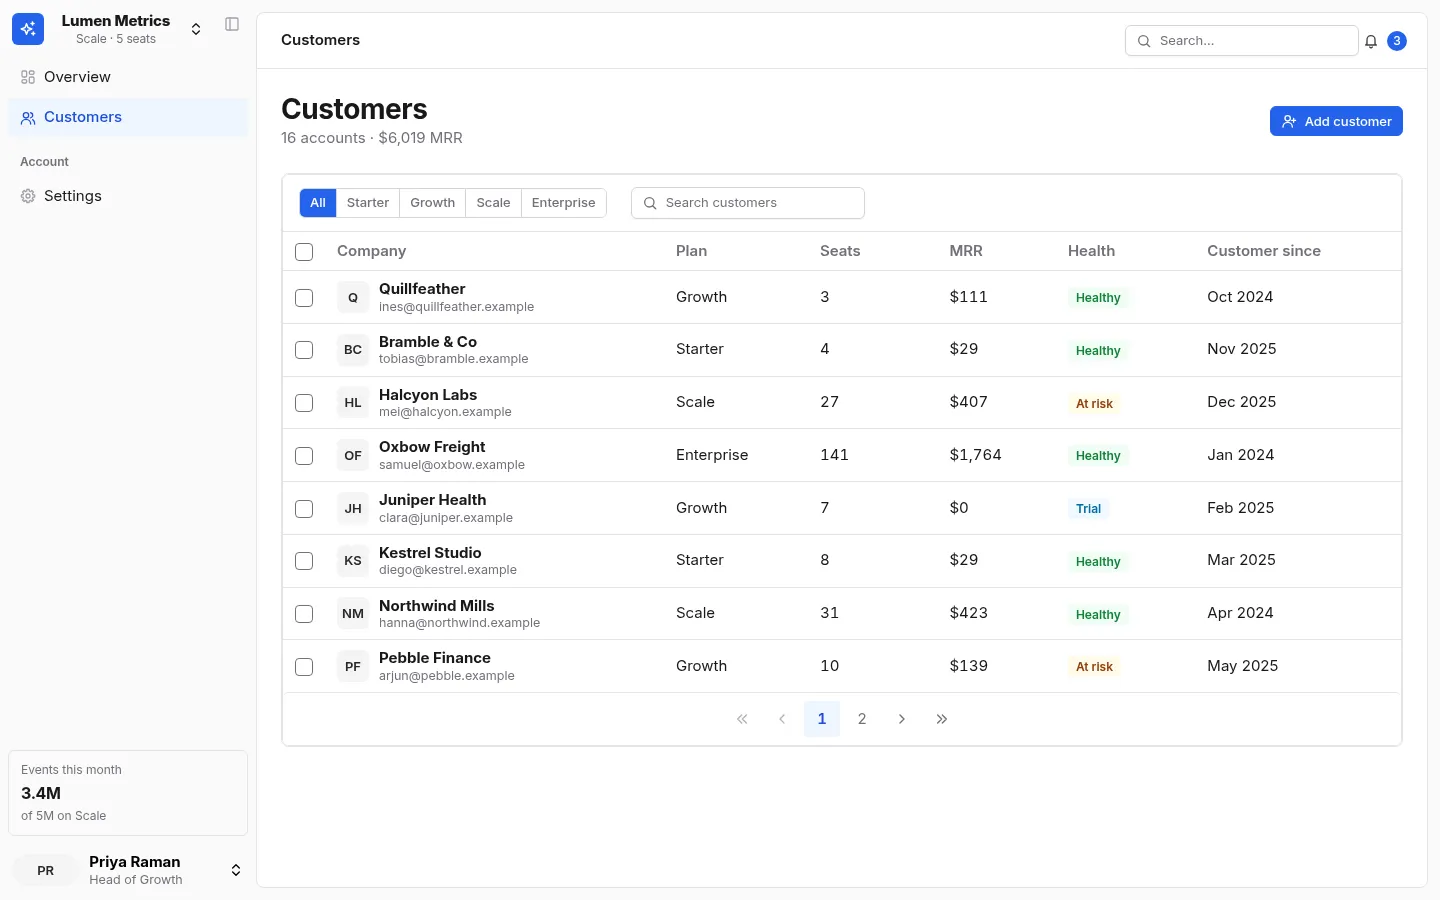
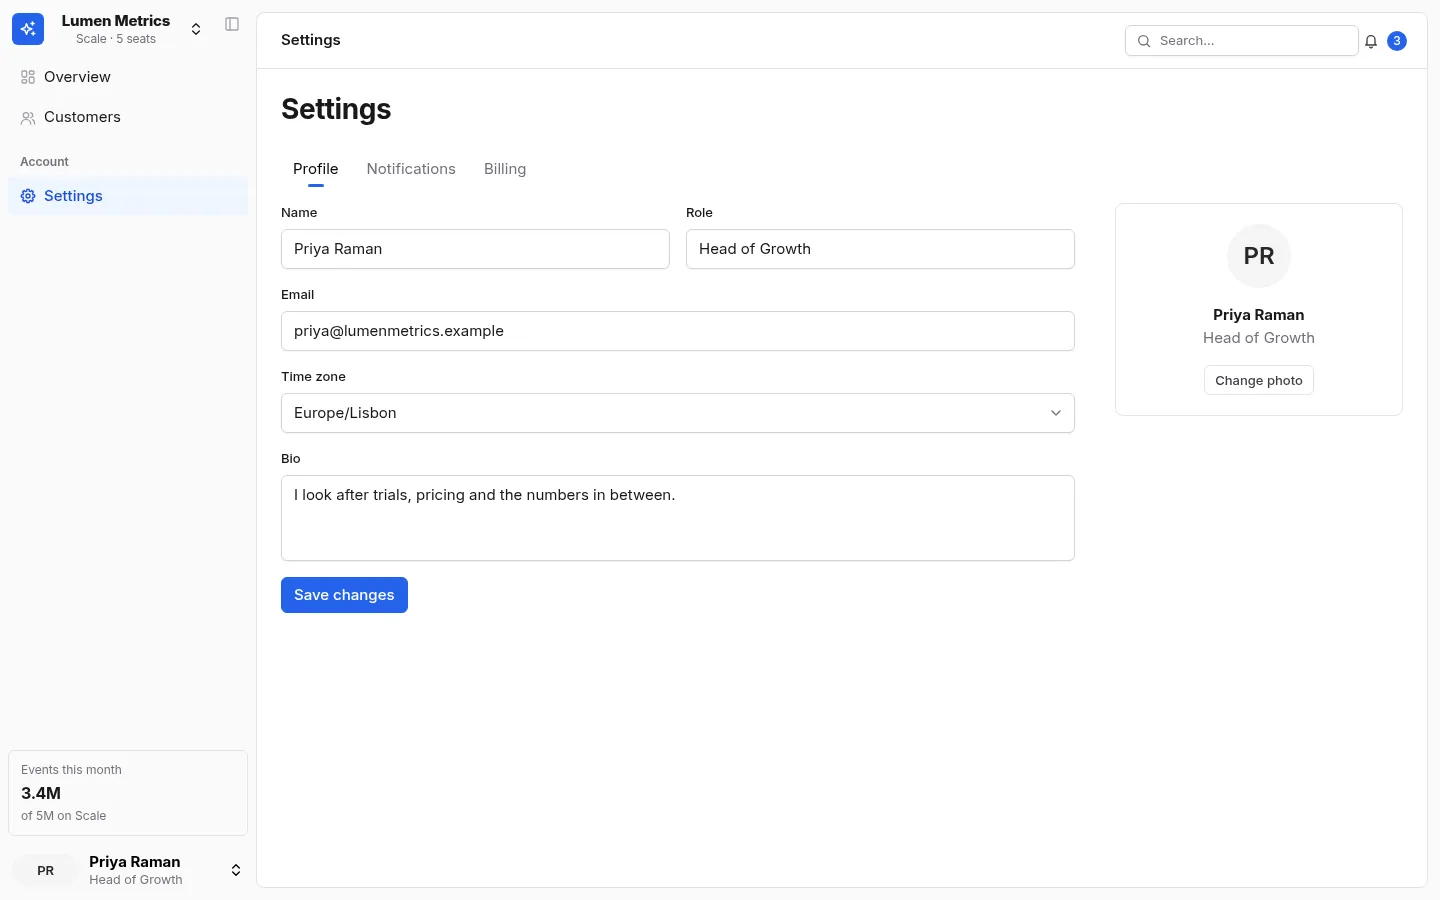
The back office of a subscription product. The overview leads with four KPIs and their trends, then revenue, plan mix and conversions; the customer table searches, filters, sorts, selects and pages; settings hold a profile form, notification switches and billing.

AdminChartsTable

Screens

  1. 1

    Overview

    KPIs, revenue and sign-up charts, plan mix and activity

    Open live
    Lumen Metrics: the Overview screen
  2. 2

    Customers

    A searchable, filterable, paginated customer table

    Open live
    Lumen Metrics: the Customers screen
  3. 3

    Settings

    Profile, notifications and billing in tabs

    Open live
    Lumen Metrics: the Settings screen

What's inside

3 screens and 17 components, wired together with shared state and local navigation.

Features

  • KPI tiles with sparklines and deltas
  • Area, bar and donut charts that take their colours from the theme
  • A customer table with global search, a plan filter, sorting, selection and pages
  • Settings in tabs: a profile form, notification switches, usage and plans
  • A brand that switches workspace, and an account menu at the foot of the sidebar
  • An inset sidebar that folds to icons on narrow screens

Screens

Questions

About Lumen Metrics, and about templates in general.

Yes. DataGrid takes a data source or runs lazy: sorting, filtering and paging are handed to your server and the markup stays the same.